
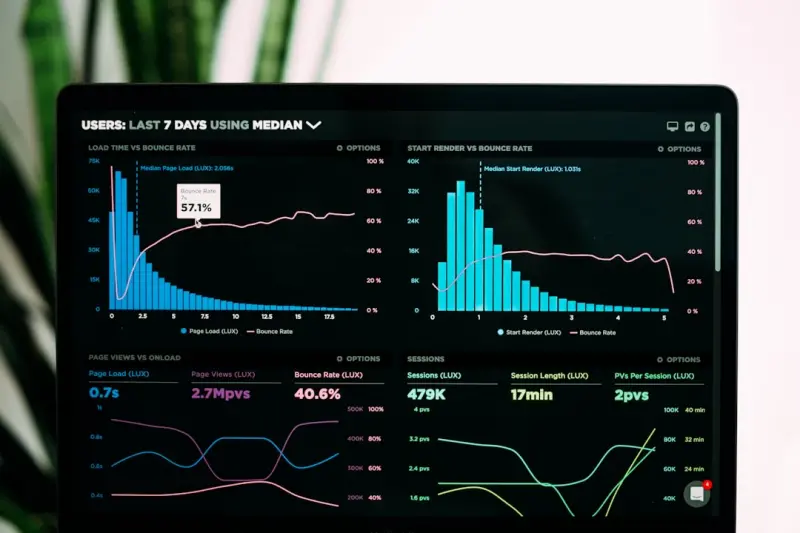
Imagine standing on a bustling city street, your smartwatch buzzing softly, a cloud of health metrics streaming to your phone. In that moment you’re not just tracking steps; you’re watching a living map of how each choice nudges the clock of your biological age. This is the promise of a personal longevity dashboard—a data‑rich cockpit that translates everyday signals into actionable strategies for a longer, fuller life.
Why Data Is the New Fountain of Youth
For centuries the quest for longevity has been guided by myths, herbs, and the occasional breakthrough drug. Today, the narrative is shifting. Every breath, stride, and heartbeat now leaves a digital breadcrumb that, when pieced together, tells a story about cellular wear, hormonal balance, and stress resilience. The difference is profound: instead of guessing which regimen works, you have a feedback loop that confirms, in real time, whether a new habit is truly turning back the clock.
The Core Components of a Longevity Dashboard
Building a dashboard that does more than count calories involves three pillars:
- Wearable & environmental sensors – devices that capture heart‑rate variability, sleep stages, ambient temperature, and even skin conductance.
- Predictive analytics engine – algorithms that compare your data against population‑level aging curves and flag deviations that matter.
- Actionable insights layer – clear, prioritized recommendations that you can implement without needing a PhD in biostatistics.
When these layers sync, you move from a passive observer of your health to an active pilot, adjusting course before small imbalances become chronic problems.
Step‑One: Curating the Right Data Stream
Not all data points are created equal. The most impactful signals for longevity fall into three categories: autonomic balance, metabolic flexibility, and recovery quality. Here’s how to capture them efficiently:
- Heart‑Rate Variability (HRV) – A robust indicator of nervous system health. Higher HRV generally signals better stress adaptation and, by extension, slower biological aging.
- Sleep Architecture – Beyond total hours, the distribution of deep, REM, and light sleep phases informs how well your brain clears waste and consolidates memory.
- Glucose & Lipid Fluctuations – Continuous glucose monitors (CGMs) paired with lipid trend sensors reveal metabolic spikes that erode vascular health.
- Movement Quality – Accelerometers that differentiate between sedentary slouching and purposeful mobility help gauge musculoskeletal vitality.
- Environmental Context – Ambient CO₂, humidity, and even electromagnetic fields can subtly influence inflammation pathways.
Choosing devices that integrate via open APIs (Apple Health, Google Fit, or proprietary platforms) ensures your data can be aggregated into a single, coherent view.
Step‑Two: Turning Raw Numbers Into Meaningful Scores
Raw streams are noisy. The analytics engine must smooth, normalize, and contextualize. A common approach is to compute a Biological Age Index (BAI) that weighs each metric against age‑matched baselines. For example, an HRV of 70 ms might be typical for a 30‑year‑old but exceptional for a 55‑year‑old, nudging the BAI downward.
Machine‑learning models trained on longitudinal cohort data can also predict risk trajectories. If your nightly deep‑sleep percentage drops by 5 % over a month, the model may forecast a modest acceleration in vascular aging—prompting a targeted intervention.
Step‑Three: Delivering Actionable Recommendations
Insights are only valuable when they’re actionable. Your dashboard should translate a BAI shift into concrete steps, such as:
- “Increase evening wind‑down routine to boost deep‑sleep by 10 %.”
- “Introduce a 10‑minute cold exposure session twice weekly to improve HRV.”
- “Swap mid‑day sugary snacks for protein‑rich options to stabilize glucose spikes.”
Each recommendation should include a why (the physiological mechanism) and a how (practical tips), empowering you to experiment confidently.
Integrating Lifestyle Science Without Repeating the Past
Many longevity discussions focus on singular interventions—light therapy, gut timing, or seasonal routines. While valuable, they can become siloed. A dashboard unifies these threads, letting you see how a change in one domain ripples through others. For instance, adjusting your environmental cues that influence metabolism might simultaneously improve sleep quality and HRV, creating a compounding benefit.
Similarly, aligning daily activities with nature’s ebb and flow—without borrowing the exact language of “seasonal rhythm”—can be quantified. By mapping your activity peaks to daylight patterns, you may discover that a morning jog followed by an afternoon creative session yields a sharper cognitive edge, a phenomenon you can track via your dashboard.
Case Study: From Data Overload to Decades Gained
Meet Maya, a 42‑year‑old product manager who felt perpetually fatigued despite a disciplined exercise routine. She equipped herself with a wrist‑worn HRV sensor, a CGM, and a smart mattress that logged sleep stages. After three months of raw data, her dashboard highlighted a recurring dip in HRV every evening, coinciding with a spike in evening glucose after late‑night coffee.
Action plan:
- Shift coffee consumption to the morning.
- Introduce a brief meditation before bed to activate the parasympathetic nervous system.
- Add a short walk after dinner to smooth post‑prandial glucose.
Six weeks later, her BAI dropped by 2.5 years, HRV rose by 15 %, and deep‑sleep increased by 8 %. Maya’s story illustrates how a data‑centric feedback loop can translate minute tweaks into measurable longevity gains.
Designing Your Dashboard: Practical Tips
Below is a checklist to help you assemble a functional longevity dashboard:
- Start Simple – Begin with two or three key metrics (HRV, sleep, glucose). Expand as you grow comfortable.
- Choose Interoperable Devices – Prioritize hardware that syncs to a central health hub.
- Set Baseline Goals – Establish your current BAI and target reductions.
- Automate Alerts – Configure thresholds that trigger push notifications for immediate action.
- Review Weekly – Dedicate a short slot each week to interpret trends and adjust interventions.
Beyond the Dashboard: Cultivating a Longevity Mindset
Data provides clarity, but the long game also requires a philosophical shift. Treat each metric not as a judgment but as a conversation with your body. Celebrate incremental wins—like a single night of improved HRV—rather than obsess over perfect scores. This mindset reduces stress, a known accelerator of cellular aging, and sustains motivation over years, not months.
Future Horizons: The Rise of the Digital Twin
Imagine a virtual replica of yourself that simulates the impact of lifestyle tweaks before you try them. Emerging platforms are building such “digital twins,” leveraging genetics, epigenetics, and longitudinal sensor data. When integrated with your dashboard, the twin can predict how a new supplement, a change in work hours, or a relocation to a different climate might shift your BAI, letting you experiment safely.
While still nascent, the convergence of AI, genomics, and wearable tech points to a future where longevity planning is as precise as a financial portfolio.
Wrapping Up: Your Path to Data‑Driven Longevity
Longevity is no longer a distant, mystical quest; it’s an engineering problem that you can solve with the right data tools. By constructing a personal longevity dashboard, you gain a transparent view of how everyday choices sculpt your biological timeline. The process is iterative—measure, analyze, act, and repeat—but each cycle brings you closer to a life that feels as vibrant as it is long.
Start today: pick a wearable, set up a simple analytics view, and watch as the numbers begin to tell a story of potential. The more you listen, the better you can steer your journey toward decades of health, purpose, and joy.

Craig Brett is a freelancer with a passion for the outdoors. His love for nature inspires his work, bringing authentic and engaging perspectives to projects related to outdoor activities, adventure, and environmental topics.
Related Posts

Reimagining Longevity: A Holistic Blueprint for a Life That Thrives
A holistic roadmap to longevity: purpose, gut health, joyful movement, sleep, stress management, and... Read More

Curiosity Unleashed: How Lifelong Learning Fuels Longevity
Explore the science behind curiosity as a longevity tool, learn practical daily habits, and see how ... Read More

Chrono‑Hormesis: Syncing Stress With Your Body Clock for Longevity
Learn how timing mild stressors—cold exposure, light therapy, and intermittent fasting—to your b... Read More
Top Posts

Movement‑Driven Leadership: Harnessing Exercise to Elevate Emotional Intelligence
Learn why integrating short, purposeful exercise into your leadership routine can enhance empathy, regulate stress, and transform team dynamics, backed by scien...Read More
Understanding Prediabetes: A Wake-Up Call for a Healthier Lifestyle
Prediabetes is a silent warning sign that can creep up on anyone. Learn how a holistic approach can help prevent and manage prediabetes, reducing the risk of de...Read More

Remote Health Coaching: A Game‑Changer for Senior Wellness
Remote health coaching offers seniors personalized, tech‑enabled guidance that improves mobility, mental health, and overall wellbeing, turning aging into an ...Read More

The Unexpected Wellness Power of Digital Storytelling for Seniors
Digital storytelling blends memory recall, gentle motor activity, and social interaction, offering seniors a novel, enjoyable way to support cognitive health an...Read More
0 Comments
Post Comment
You will need to Login or Register to comment on this post!